Gdoc/Admin

Popular pages

Research and data to make progress against the world’s largest problems.

14,379 charts across 123 topicsAll free: open access and open source

Our Mission

What do we need to know to make the world a better place?

To make progress against the pressing problems the world faces, we need to be informed by the best research and data.

Our World in Data makes this knowledge accessible and understandable, to empower those working to build a better world.

Read about our mission

We are a non-profit — all our work is free to use and open source. Consider supporting us if you find our work valuable.

Donate to support us
As seen on
Logos of the publications that have used our content. From left to right: Science, Nature, PNAS, BBC, Financial Times, The New York Times, The Guardian, The Atlantic, and The Washington Post

Data Insights

Bite-sized insights on how the world is changing, published every few days.

See all Data Insights
A line graph illustrating the decline in child pneumonia deaths in Nepal from 1980 to 2021 is presented at the top with the title, "Child pneumonia deaths have dropped dramatically in Nepal, but it's still behind wealthier nations." The vertical axis represents estimated annual deaths per 100,000 population, ranging from 0 to 1,400, while the horizontal axis marks the years from 1980 to 2021. 

The graph shows a steep downward trend starting from around 1,400 deaths per 100,000 in the 1980s, indicating that Nepal had one of the highest rates of child pneumonia deaths at that time. A significant drop is observed, and by 2021, the death rate declined to 75 per 100,000. A note emphasizes that high-income countries have a much lower death rate, depicted by a flat line near the bottom of the graph.

Data sources cited at the bottom are IHME and Global Burden of Disease, with the date of the data being 2024. The graph is attributed to the Creative Commons BY license.

Childhood pneumonia deaths have plummeted in Nepal — and more lives can still be saved

In the early 1980s, Nepal’s children suffered from some of the highest death rates from pneumonia in the world, with over 1,400 deaths for every 100,000 children under five. That meant around 39,000 children died from pneumonia each year, more than from any other cause.

Since then, Nepal has made huge progress. The death rate has fallen almost 20-fold. This improvement is due to various measures, including pneumococcal and Hib vaccines, better access to healthcare and antibiotics, and improved nutrition.

Despite this progress, pneumonia is still among the leading causes of death in children in Nepal. And we know that more progress can be made: high-income countries have achieved much lower rates, with fewer than 5 per 100,000.

Explore how deaths from pneumonia among children have changed in other countries

Continue reading
A bar chart displays two categories of financial data for the year 2021, measured in US dollars. The first bar, labeled “Money sent or brought back by migrants,” is significantly taller at $781 billion, indicating a substantial amount. The second bar, labeled “Foreign aid,” is shorter at $202 billion, highlighting a smaller figure. An arrow points from the first bar to the right, accompanied by a note stating that worldwide, migrants send or bring back over three times more money than foreign aid provides. The chart is sourced from the World Bank, with a note specifying that "foreign aid" refers to net official development assistance. The overall design is attributed to "Our World in Data," and it includes a Creative Commons BY license.

Money sent home by international migrants is almost three times as much as global foreign aid

When we think about money flowing from richer to poorer countries, foreign aid is one of the first things that comes to mind.

However, another major channel receives far less attention in mainstream conversations: the money international migrants send back to their families or bring home after working abroad. Unlike aid, which is publicly funded and often targeted at structural development, these private transfers typically aim at family support to cover critical needs such as food, healthcare, and education.

This chart shows how big that contribution is: in 2023, migrants sent or brought back $822 billion, almost three times the $288 billion provided through global foreign aid. Global foreign aid refers to net development assistance from national governments, with a very small portion coming from private donor philanthropy that meets the criteria for development assistance.

While this gives us a good sense of the size of these different flows, it’s important to note that the distribution of where each goes tends to differ. Most of the money sent home by migrants goes from high-income to middle-income countries, but low-income countries also rely on them relative to their GDP. When it comes to foreign aid, low-income countries receive almost as much money as middle-income countries.

Learn more about money sent or brought home by migrants

Continue reading
This image depicts a line graph illustrating the number of recorded natural disaster events from 1900 to 2023. The y-axis represents the total number of disasters, ranging from 0 to 500, while the x-axis displays the years.

The graph shows a gradual increase in recorded disasters from 1900 to the late 1970s, followed by a sharp rise in the number of events in the 1980s and 1990s, peaking around the year 2000. Since then, there is a noticeable fluctuation in numbers, with some ups and downs but an overall increase.

Annotations on the graph highlight key milestones: the establishment of the Center for Research on the Epidemiology of Disasters (CRED) in 1973, and the formation of the EM-DAT database in 1988. Additionally, a note indicates that the database is mostly complete from the year 2000 onwards.

Data source information is located at the bottom, listing EM-DAT, CRED, and UCLouvain, with a copyright notice indicating it's licensed under CC BY.

Most of the increase in natural disasters in the late 20th century is due to improved reporting

Tracking the occurrence of natural disasters can save lives by helping countries prepare for future ones.

In our work on natural disasters, we visualize data from EM-DAT, the most comprehensive international disaster database. Make a chart of the number of recorded disaster events over time — like the one above — and it looks like the number of disasters rose alarmingly from the 1970s to the millennium. This has led to many media outlets and organizations claiming that the number of disasters has quadrupled over the last 50 years.

However, as EM-DAT itself makes clear, most of this is due to improvements in recording. The Centre for Research on the Epidemiology of Disasters, which builds this database, was not established until 1973, and didn’t start publishing EM-DAT until 1988.

The number of recorded disasters increased due to more focused efforts to obtain globally comprehensive data and improvements in communication technologies, which allowed more events to be included, even in the planet's most remote areas.

EM-DAT suggests that only data from 2000 onwards is relatively complete and comparable. The number of events before 2000 is likely to be underestimated. Note that this data does not tell us anything about the intensity of disasters.

Read my full article, with my colleague Pablo Rosado, on the limitations of disaster databases

Continue reading
A line graph depicting global military spending from 1988 to 2024. The y-axis represents the spending amounts in US dollars, ranging from zero to three trillion dollars, while the x-axis indicates the years. 

A line shows a notable increase in recent decades: from 1.2 trillion dollars in the late 1990s to 2.7 trillion in 2024. A note emphasizes that global military spending more than doubled between the late 1990s and 2024.

The data source is credited to the Stockholm International Peace Research Institute, with the publication date suggested as 2025, and the image includes a CC BY license.

In 2024, global military spending reached its highest level in decades

Global military spending reached its lowest point of $1.2 trillion in the late 1990s. Since then, military spending has more than doubled, reaching $2.7 trillion in 2024.

The chart shows a drop in military spending after the Cold War ended in 1989. This freed up resources for public expenditure in other domains, sometimes called the “peace dividend”.

But global military spending surged again in the 2000s, partially driven by US spending for the wars in Iraq and Afghanistan, reaching $2 trillion by 2010. After stabilizing for a few years, it has risen sharply in recent years, fueled in part by the war in Ukraine.

Despite these increases, military spending as a share of GDP remains lower than in 1988 in most countries, as economies have grown substantially over this period.

We’ve recently updated our charts on military spending — browse them for different countries in our data catalog

Continue reading
The image presents a line graph showing the number of countries where smallpox was endemic from 1920 to 1980. There are five colored lines representing different regions: Africa, Asia, the Americas, Europe, and Oceania. 

The y-axis indicates the number of countries, ranging from 0 to 50, while the x-axis marks the years from 1920 to 1980. Each region's line trends downward, reflecting a decline in endemic countries over the years. Significant events are marked with dashed vertical lines: in 1959, the WHO resolved to aim for eradication; in 1967, an intensified eradication campaign began; 1977 marks the last recorded case; and in 1980, smallpox was declared eradicated.

A note at the bottom specifies that the precise year of elimination in Oceania is only known for Australia (1917) and New Zealand (1914). Additionally, data sources are cited as Fenner, Henderson, Arita, Jezek, and Ladnyi (1988) and the graph is attributed to Saloni Dattani, licensed under CC-BY. The source of the data is Our World in Data, which focuses on research and measures against global issues.

Smallpox declined gradually, until the WHO coordinated the global effort to eradicate it

In 1796, Edward Jenner developed the world’s first vaccine against smallpox. As it was refined and widely adopted, many countries in Europe and North America, the Soviet Union, and island nations eliminated smallpox through national vaccination programs.

But in the mid-20th century, the disease remained widespread across Africa and Asia, infecting tens of millions every year.

Before the World Health Organization (WHO) committed to eradication in 1959, few believed it was possible, given the failures of other eradication efforts like malaria. But smallpox had no animal reservoir, clear symptoms, and there was an effective, low-cost vaccine.

By 1967, the WHO intensified the eradication campaign with more funding. The strategy focused on “ring vaccination” — containing outbreaks by vaccinating people around each case — and embedding the work within local health programs.

As the chart shows, this approach worked swiftly: within a decade, the number of endemic countries fell to zero. Smallpox was officially declared eradicated in 1980, two centuries after Jenner’s discovery. It’s a lasting triumph of science and cooperation.

Read more on our page on smallpox

Continue reading
A line graph displaying the annual number of deaths from road injuries per 100,000 people from 1990 to 2021 for various countries. The title reads, "Portugal's roads have become much safer over the last 30 years," with a subtitle explaining that the data includes fatalities from different road users such as drivers, passengers, motorcyclists, cyclists, and pedestrians.

The y-axis indicates the number of deaths, ranging from 0 to 40, while the x-axis represents the years from 1990 to 2021. Each country is represented by a line on the graph, with points marking the annual data for that year. The following countries are displayed: Latvia at 36.4, Portugal at 31.1, Poland at 23.5, Spain at 22.7, Greece at 20.1, France at 18.9, Belgium at 18.4, Italy at 16.6, Germany at 14.3, Finland at 13.1, Sweden at 9.6, United Kingdom at 9.5, Norway at 9, and two lines indicating Portugal's decrease to 5.4 deaths by 2021. 

The data source is noted at the bottom as IHME, Global Burden of Disease (2024), with a CC BY license, and a note explaining that the values are age-standardized for comparability between countries and over time.

Portugal's roads have become much safer over the last thirty years

Thirty years ago, Portugal had some of the most fatal roads in Europe. It was second only to Latvia in terms of death rates from road injuries.

But since then, death rates have fallen by 84%.

The chart shows road deaths per 100,000 people compared to other European countries. This metric is age-standardized, so it keeps the population's age distribution constant over time.

Portugal still has slightly higher death rates than many of its neighbors in Western Europe, but the gap is much smaller than in the 1990s.

Portugal’s roads have become much safer for many reasons, including seatbelt laws, speed limits, stricter drink-driving enforcement, better road design and pedestrian zones, and improvements in the safety and resilience of cars themselves.

While it made dramatic improvements over the 1990s and early 2000s, this progress has slowed in the last five to ten years.

Explore road death rates across other countries →

Continue reading
A line graph illustrating the estimated share of newborns in the Netherlands who die before reaching age five from 1840 to 2023. The y-axis represents the percentage of children dying before age five, ranging from 0% to 40%, while the x-axis shows the years from 1840 to 2023.

The graph has a prominent downward trend, indicating a significant decline in child mortality rates over time. 

The data sources listed at the bottom include Gapminder (2015) and UN IGME (2025). The design is attributed with a copyright notice indicating "CC BY."

Less than 200 years ago, one in three Dutch children died before the age of five

Losing a child is one of the worst things that can happen to a parent.

Imagine living in a world where there was a one-in-three chance your child would die. This wasn't just the reality for your children; it could just as well happen to your siblings, friends, or neighbors.

Such a world seems unimaginable today, but it wasn’t too far from reality two centuries ago, even in some economically advanced countries.

The chart shows the share of newborns who died before age five in the Netherlands since 1840. These historical estimates are more uncertain than recent data, but it's likely that before the 1870s, about one-in-three newborns died. Each birth carried odds no parent today could contemplate facing.

But a huge amount of progress has been made since then. Today, one in 250 Dutch children dies. This progress was driven by many factors, including improvements in nutrition, access to clean water, sanitation, vaccines, and reductions in poverty.

To learn more, read my colleague Hannah’s recent article: “Children in rich countries are much less likely to die than a few decades ago, but we rarely hear about this progress”

Continue reading

Get Data Insights delivered to your inbox

Receive an email from us when we publish a Data Insight (every few days).

By subscribing you are agreeing to the terms of our privacy policy.

Explore our data

Featured data from our collection of 14,379 interactive charts.

See all our data

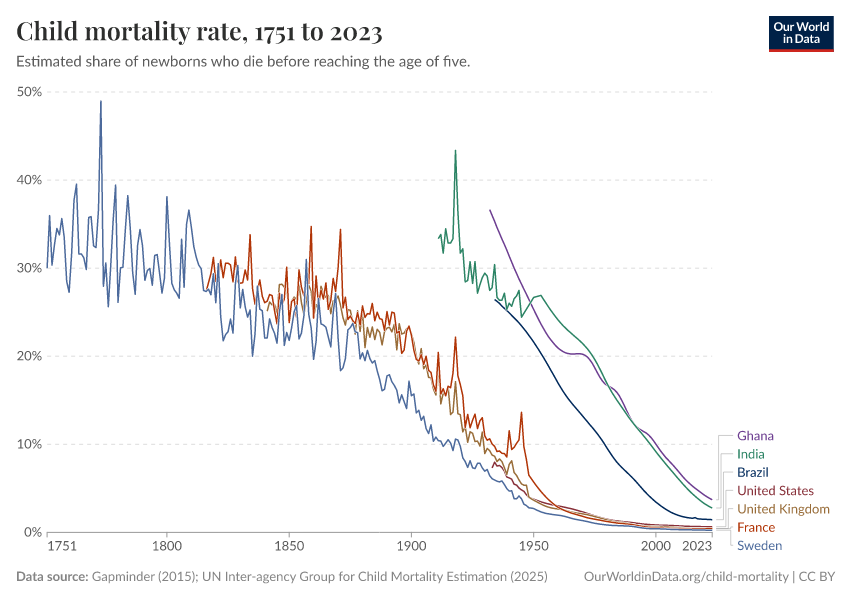
What share of children die before their fifth birthday?

What could be more tragic than the death of a young child? Child mortality, the death of children under the age of five, is still extremely common in our world today.

The historical data makes clear that it doesn’t have to be this way: it is possible for societies to protect their children and reduce child mortality to very low rates. For child mortality to reach low levels, many things have to go right at the same time: good healthcare, good nutrition, clean water and sanitation, maternal health, and high living standards. We can, therefore, think of child mortality as a proxy indicator of a country’s living conditions.

The chart shows our long-run data on child mortality, which allows you to see how child mortality has changed in countries around the world.
Explore and learn more about this data

Share of population living in extreme povertyWorld Bank

Life expectancy at birthLong-run estimates collated from multiple sources by Our World in Data

Per capita CO₂ emissionsLong-run estimates from the Global Carbon Budget

GDP per capitaLong-run estimates from the Maddison Project Database

Share of people that are undernourishedFAO

Literacy rateLong-run estimates collated from multiple sources by Our World in Data

Share of the population with access to electricityWorld Bank

Data explorers

See all our Data Explorers

Interactive visualization tools to explore a wide range of related indicators.

Subscribe to our newsletters

Receive our latest work by email.
By subscribing you are agreeing to the terms of our privacy policy.

All our topics

All our data, research, and writing — topic by topic.

Population and Demographic Change

Health

Energy and Environment

Food and Agriculture

Poverty and Economic Development

Education and Knowledge

Innovation and Technological Change

Living Conditions, Community and Wellbeing

Human Rights and Democracy

Violence and War

OSZAR »